Read pressure drop as a system signal, not a diagnosis by itself
Pressure drop is the difference in pressure between two defined points as gas moves through a component or system. In an RCO installation, resistance may include inlet ducts, pretreatment, regenerative heat-storage surfaces, catalyst modules, dampers, outlet ducts, and stack components. A single reading at the fan does not identify which component is responsible. The first requirement is to know where pressure is measured and what equipment lies between those points.
Baseline measurements should be collected during a documented operating mode. Record flow or the approved flow indicator, fan speed or operating point, product recipe, inlet temperature, pressure taps, and relevant process conditions. If clean-equipment data are available, preserve them alongside later readings. Without context, a higher pressure value might reflect a different flow rate rather than a developing restriction.
Review pressure-drop troubleshooting factors →
Measure across defined points
Compare at equivalent flow
Check the full gas path
Establish a useful pressure baseline
Flow is central because resistance changes with gas movement. A higher flow can produce a higher pressure difference even when equipment condition is unchanged. Conversely, a lower reading does not prove that the system is clean; a fan or damper change may have reduced flow. Compare readings at similar operating points or use the supplier’s approved method for interpreting trends across different flows.

Check the measurement chain before opening equipment. Verify that pressure taps are not blocked, tubing is intact, transmitter range is appropriate, and the display uses correct engineering units. A plugged impulse line or drifted sensor can mimic a process problem. Instrument checks must follow site procedures and be carried out by qualified staff; do not defeat protection or alter a control limit just to obtain a convenient reading.
Pretreatment is one potential source of restriction. Loaded filters, accumulated mist, blocked drains, or deposits in separators can increase resistance before gas reaches the RCO. Review differential pressure across individual pretreatment components where instruments exist, and compare maintenance records with the first change in trend. Do not assume the catalyst is responsible simply because the treatment unit is the most visible equipment.
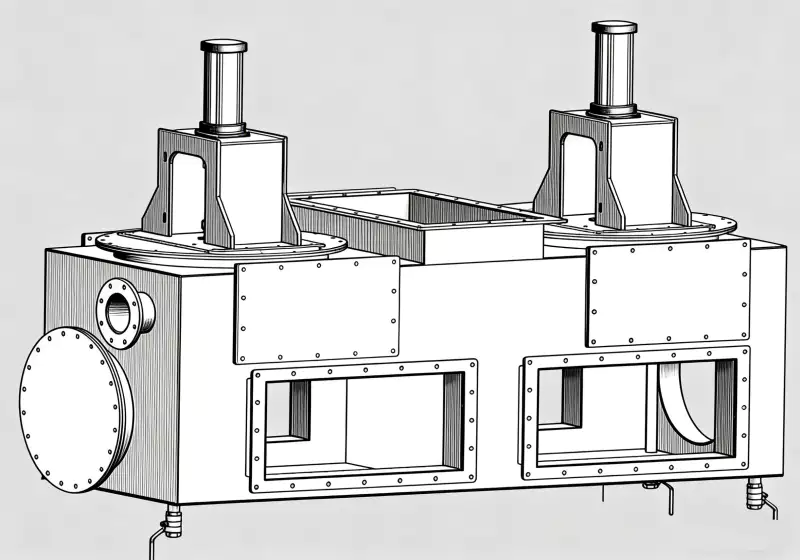
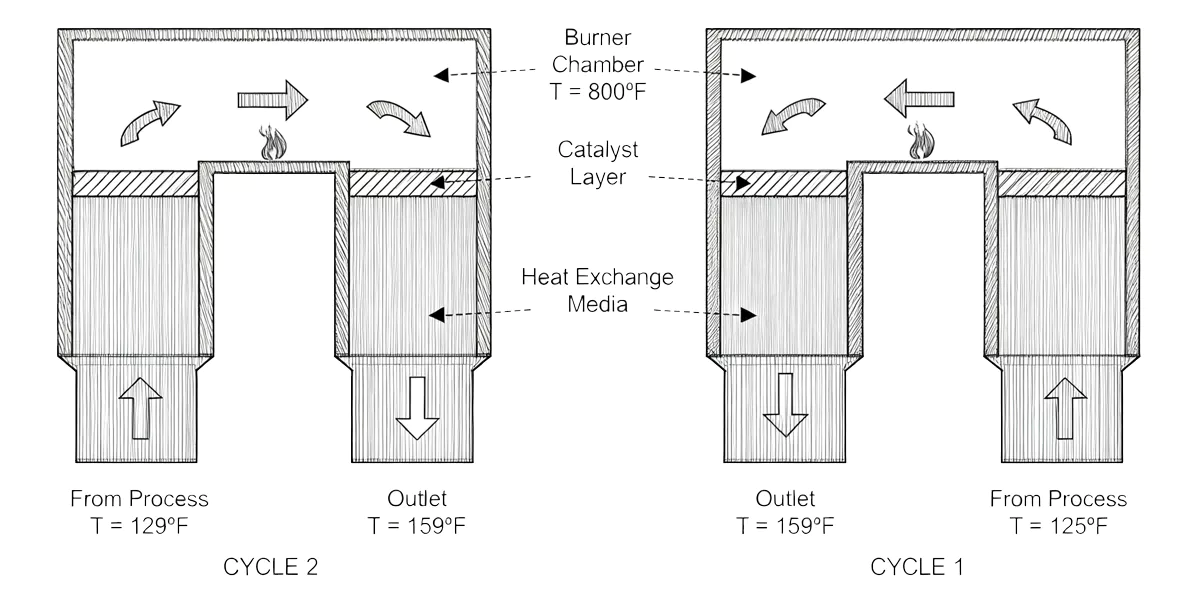
Regenerative media can accumulate deposits or experience a change in flow distribution. The likely mechanisms depend on exhaust chemistry, media configuration, operating cycle, and upstream treatment. Inspect only according to the approved procedure and with required isolation, cooling, and gas testing. A visual observation may help identify deposits, but the team should also check flow, pressure, and process history before concluding media replacement is necessary.
Catalyst channels add resistance and can be affected by dust, aerosols, condensable material, or damage. A pressure-drop change may be associated with deposits, but catalyst activity and pressure resistance are not the same property. Some chemical deactivation may occur without a large pressure change, while physical deposits can increase resistance without proving irreversible activity loss. Keep these diagnostic questions separate.
Ductwork and dampers deserve attention because changes outside the vessel can alter the system curve. A partly closed damper, collapsed flexible section, damaged liner, deposit at a low point, or unauthorized modification may affect pressure and flow. Compare the current installed arrangement with drawings and inspect accessible components under approved procedures. A vessel-only inspection can miss the cause if restriction is upstream or downstream.
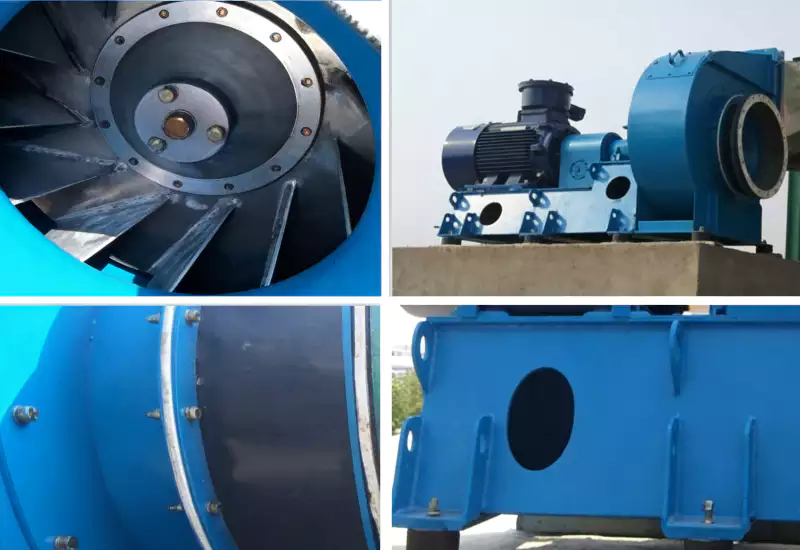
Fan performance should be considered together with system resistance. Changes in fan speed, blade condition, drive settings, inlet conditions, or motor behavior can change operating point and measured pressure. Record relevant fan data and compare them with the original basis. Increasing speed without understanding the restriction may increase power consumption or create problems elsewhere in the collection network.
Gas distribution can be uneven even when total pressure appears acceptable. Maldistribution may be associated with duct geometry, blocked passages, poor transitions, deposits, or changes in branch balancing. The effect depends on the equipment arrangement and can influence catalyst contact or heat transfer. Where distribution is suspected, use an appropriate engineering assessment rather than inferring uniformity from a single pressure tap.
Diagnose the change in a controlled sequence
Temperature and condensation may explain some pressure trends. If gas cools along the duct or inside upstream equipment, condensable material can form deposits or liquids can accumulate in low points. The risk depends on composition and actual temperature profiles. Review startup, shutdown, seasonal, and low-load conditions because these may differ from normal production. Do not assume a system dry during a short inspection remains dry throughout operation.
| Observation | Possible cause group | First evidence to review |
|---|---|---|
| Pressure rises across pretreatment | Filter loading, mist or deposit accumulation | Component differential pressure and service history |
| Pressure rises across catalyst section | Deposits, channel restriction, flow change | Flow-normalized trend and approved inspection |
| Fan speed changes with pressure | Different operating point or system resistance | Fan data, control commands, flow indication |
| Pressure changes after a recipe shift | Changed gas properties or deposit formation | Process timeline, chemistry, temperature profile |
| One sensor changes abruptly | Tap blockage, tubing issue, transmitter drift | Calibration, tap condition, adjacent measurements |
Process changes can change pressure behavior without a mechanical failure. A new recipe, more exhaust branches, changed capture settings, additional dilution, or a different production schedule can alter flow and gas properties. Compare the time of the pressure shift with operating and maintenance records. If the process envelope has changed, assess the design basis before treating the new trend as ordinary equipment deterioration.
A useful diagnostic approach compares pressure with other signals. Review flow, fan speed, temperature, energy input, process mode, alarms, and pressure readings across individual components where available. If only one instrument is available, state the limitation and plan the next measurement that can distinguish likely causes. A short targeted survey may be more valuable than immediately dismantling the catalyst housing.
Maintenance actions should follow the evidence. A loaded filter may require service under supplier instructions; a blocked tap may require instrument maintenance; deposits may call for approved cleaning or upstream correction; a fan issue needs its own review. Do not use improvised mechanical cleaning or chemicals on catalyst or regenerative materials. Keep corrective action tied to a diagnosed mechanism and record before-and-after readings.
Practical review workflow
Pressure-drop alarms and operating limits should be based on the approved design and hazard review. A general threshold copied from another plant may be inappropriate because equipment layouts, flow ranges, and measurement locations differ. Confirm what the alarm represents, which operating state it assumes, and what response is authorized. Protective setpoints should not be modified without the required engineering and management-of-change process.
After maintenance, reproduce baseline conditions as closely as practical. Record the same measurement locations, flow basis, fan operating point, process mode, and temperature. If conditions differ, note the difference and avoid a misleading direct comparison. The report should state what was inspected, what was found, what changed, and whether further monitoring is required.
Trend quality improves when readings are tied to operating context. Store pressure data alongside recipe, production rate, flow, fan status, and maintenance events. A monthly average can hide a brief high-load condition or gradual increase. Where the control system supports historical trends, define review interval and responsible person according to plant procedures, and keep records accessible for troubleshooting.
Investigate catalyst performance changes →
Use pressure information to improve prevention. If deposits repeatedly appear at a duct section, review source, temperature profile, drainage, capture, and pretreatment rather than simply cleaning the same area repeatedly. If pressure rises after a recipe change, assess the new contaminant profile. Root-cause correction is more sustainable than a calendar task that treats every symptom as inevitable.
Pressure drop also belongs in procurement and acceptance. Ask suppliers for the pressure basis at specified flows and operating modes, including what is known about clean and expected service conditions. Identify measurement locations and how future readings will be compared. This gives operations a baseline for maintenance and makes competing equipment proposals easier to compare without inventing a universal acceptable value.
The practical lesson is that pressure drop is evidence, not a complete explanation. Define measurement points, compare equivalent operating conditions, verify instruments, review the entire gas path, and follow approved inspection procedures. That sequence protects staff, reduces unnecessary component replacement, and creates a useful record for the next operating change.
 SK
 EN
 ZH
 ES
 AR
 ID
 PT
 FR
 JA
 RU
 DE
 MS
 CS
 BG
 NL
 KO
 RO
 TH
 VI
 ZH_TW
 UK